On this page
Data disclaimer
The DJSIR Tourism and Events research unit takes due care in the preparation of all research content. All information is considered correct at the time of publishing but may be subject to revisions.
By using this information, you acknowledge that this information is provided to you without any responsibility on behalf of DJSIR.
DJSIR does not represent or warrant that this information is correct, complete, or suitable for the purpose for which you wish to use it.
The information is provided to you on the basis that you will use your own skill and judgement and make your own enquiries to independently evaluate, assess and verify the information’s correctness and usefulness to you before you rely on the information.
Data sources
Domestic and international visitation data is primarily sourced from the National Visitor Survey (NVS) and International Visitor Survey (IVS), produced by Tourism Research Australia (TRA). Data from the NVS and IVS is published quarterly.
Monthly international visitation data for main state of stay is sourced from Overseas Arrivals and Departure (OAD) data from the Australian Bureau of Statistics (ABS).
Most tourism economic data is based on State and Regional Tourism Satellite Accounts, produced by TRA annually.
Referencing data
You should acknowledge all information used from the Tourism and Events research unit from the Victorian Government Department of Jobs, Skills, Industry and Regions (DJSIR). The primary data source should also be cited e.g., National Visitor Survey, TRA.
Find out more about tourism data at Tourism Research Australia.
Important data notes
When reading and interpreting the data, it's important to take into account that:
- Data estimates may be impacted by rounding.
- Visitors to different locations cannot be added as some people may visit multiple locations on the same trip. For example, visitors to Melbourne and regional Victoria may not add up to the Victoria total.
- NVS and IVS data only includes visitors aged 15 years or over.
- NVS domestic daytrip visitors must have a round trip distance of at least 50 kilometres from the respondent’s usual place of residence and a minimum duration of four hours.
- Domestic daytrips taken as part of an overnight trip, or those that are routine are not included in daytrip data. For example, trips from home to work/school, or an intrinsic part of a person’s job are not counted as daytrips.
- NVS domestic overnight visitors must include at least one night away from home and be a minimum of 40 kilometres from the respondent’s usual place of residence.
- IVS data includes international short-term visitors who stay in Australia for less than 12 months.
- International education visitors captured in the IVS are defined as those who stay in Australia for less than one continuous year. Not all international students are incorporated in this definition which differs from enrolment data.
- Due to various data input and methodology changes, the most recent data should only be compared to the revised published time series to ensure like-for-like comparisons.
Data limitations
There are a range of limitations with the data to consider, such as:
- Estimates from the NVS and IVS are based on a sample rather than a census. The survey results are subject to sampling variability.
- Data will not display or show as np (non-publishable) if an estimate does not meet publishing reliability thresholds due to survey data limitations.
- IVS surveying was halted when international borders where closed due to COVID-19. Some limitations to the data apply from March 2020 to November 2023.
- Tourism is not included in the National Accounts as it based on consumption rather than production and cannot be measured in the same ways as other industries. Tourism economic data is delivered in a special framework in the National Tourism Satellite Accounts to understand the value of goods and services consumed by visitors.
- Economic data estimates are subject to a long delay in release due to the complexity of deriving outputs via Tourism Satellite Accounts.
Refer to Tourism Research Australia for more information.
Interactive charts
Interactive data elements are featured on this website which have been built using the RStudio data analytics platform.
Figure 1. Interactive chart example
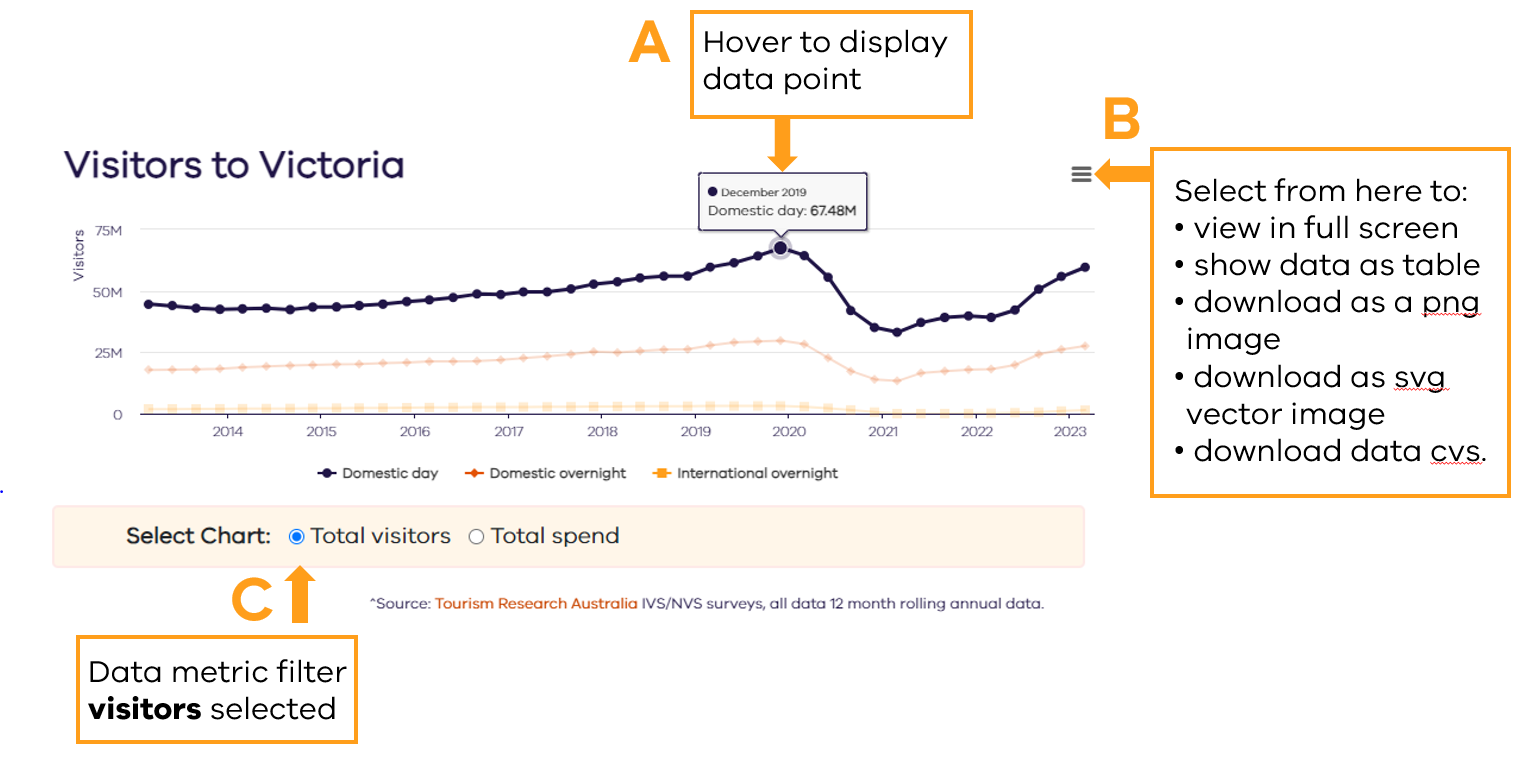
- Display data – By hovering above the chart, using tabs or the keyboard you can display data points. This is illustrated in figure 1 in box A.
- Chart options – In the top right hand corner of the chart you can select to view the chart in full screen, view the data as a table, download the image as a png, download a svg vector image or download a data cvs file. This is illustrated in Figure 1 in box B.
- Switch data metrics – At the bottom of some charts you can switch data metrics by selecting the button. This is illustrated in Figure 1 in box C.
- Per cent change – up and down arrows have been used in some data displays to show where data has increased or decreased over time.
- YoY = year-on-year percentage change.
Data dashboards
The Tourism and Events research team have created dashboards with key tourism statistics with Microsoft’s Power BI platform. The data is updated regularly with the latest available estimates.
Tips for using the dashboards
- Home - The home icon takes user to the first page (in select dashboards only). Some dashboards will also have a contents menu.
- Navigation - Select the left < or right > arrows at the bottom of the page to scroll through the dashboards with multiple pages or click on the page numbers to navigate to the relevant page.
- View full screen - Each dashboard is displayed within a frame. In the bottom right hand corner of the frame is a full screen icon showing as a line with arrows at either end pointing outwards. Select this icon to make the dashboard full screen size. To exit press the ESC key.
- View data in charts - Hovering your mouse over a point in the chart will display the value for that point and may display more information.
- Filtering data – Most dashboards have drop-down lists at the top of the page where you can filter the data by variables such as time, destination or visitor type. Victoria is usually the default geography selected.
- Data metrics - You can switch the data metric on some charts by selecting a button which will highlight the metric in use e.g., spend, visitors or nights. These are represented in the chart selection area typically at the bottom right.
- Show data as a table – By right clicking on some charts you can display data in a table.
- Sharing – You can share the dashboard via a URL, Facebook, Twitter, LinkedIn or email by selecting the share icon at the bottom right-hand side of the screen.
- Snip to copy charts – You can use the Windows snipping tool to copy elements from the dashboard into documents or to capture a screenshot. Press the Windows logo key + Shift S to snip with a keyboard.
Accessibility
The Microsoft Power BI application presenting data on this website has limited accessible functionality. Microsoft are continuously working to improve this and any enhancements will be implemented as they are made available.
Some keyboard shortcuts for accessibility include:
- Tab = selects the dashboard (isolates from the rest of the page)
- Ctrl + Enter = enter the dashboard
- Use Tab or arrow keys to navigate through the dashboard
- Enter = enter a visual or layer
- Esc = exit a visual or layer
- Alt + Shift + F11 = show as a table
- Ctrl + H = show data point details on a chart (brings up the tooltips for a data point)
- ? = show all keyboard shortcuts